
What is risk analysis and why is it important?
Risk and uncertainty often spell danger or reward; it’s an inevitable part of any business plan. While impossible to eliminate, it can be thoroughly analyzed and managed with the right tools.
Risk analysis identifies, categorizes and analyzes potential and expected impacts on a topic of interest, with special attention paid to negative impacts.
It focuses on uncertainty and the probability of events, with the aim of limiting the harmful effects of possible outcomes.
Risk analysis is essential when making business decisions that maximize rewards and weigh unforeseen risks.
When analyzing risk in business, it’s essential to distinguish between qualitative and quantitative risk. Measuring risk numerically constitutes the backbone of the risk analysis process.
Describing risk qualitatively is a great place to begin and also yields valuable information and frames the risk assessment around questions of interest.
Qualitative risk analysis and SWOT
One way to begin the risk analysis process is with a simple SWOT (strengths, weaknesses, opportunities, threats) analysis. To understand the topic of interest, first identify its positive and negative traits.
Imagine a conversation with someone heavily involved in the topic of interest and form questions based on your general knowledge.
How does a company compare to the competition? Where might it improve? Is it prepared for a worst-case scenario?
Categorizing your answers with SWOT helps distinguish between potential rewards and risks. Worded questions, both specific and general, provide insight into potential risks and what metrics to investigate.
Applying SWOT analysis to Amazon, note that the company’s large workforce enables higher operating capacity compared to competitors.
As a result, the company’s market share levels are rising, presenting an opportunity. On the other hand, you may find that Amazon’s average financial risk potentially threatens performance.
SWOT analysis offers a solid framework and starting point for identifying rewards and risks. Furthermore, it organizes your post-risk analysis findings for direct comparison between rewards and risks.
Starting out with risk ratings
To make tangible sense of risks, it’s best to describe them numerically. Risk ratings offer an easy-to-understand metric to do this. Ratings incorporate various data to describe a general idea. For example, IBISWorld provides structural risk ratings for industries.
This score numerically describes the fundamentals of an industry, such as competitiveness, volatility and barriers to entry. The score, on a scale of 1 to 5, gives a simple indicator of low, medium or high levels of risk.
Using the same scale, growth ratings combine recent years of growth with forecast growth to determine the strength of the industry moving forward. Sensitivity risk scores account for external factors affecting industry performance.
For example, the percentage of Americans with private health insurance and federal funding for Medicare factor into the sensitivity rating of the Hospitals industry, giving an idea of vulnerability to changes in these external factors.
Each score contributes to an overall risk rating for an industry. Looking at these ratings, you gain a basic idea of how risky an industry is.
Unraveling risk with ratios
Ratios also enable quick and simple risk assessment. The key, however, is understanding the components of the ratio and how they relate.
Ratios generally answer the following question: how much of A accounts for B? Or: how many times could A cover B? For example, when analyzing the Hospitals industry in the United States, ask yourself, how much revenue is going towards wages?
Simply dividing wage by revenue results in a tangible percentage from which you can assess vulnerability to increase wages.
Liquidity ratios measure credit risk such as debt coverage and risk of defaults. For example, the quick ratio is calculated by current assets minus inventory divided by current liabilities and assesses the ability to cover liabilities over a short period of time.
Return on assets, measured as net income divided by total assets, describes operating efficiency and how effectively assets generate sales.
These ratios help determine what poses a risk or what could eventually pose a risk.
Putting risk into perspective with comparative benchmarks
Tangible as these numbers may be, compared with some standards, it puts ratings, ratios and risks into perspective. For example, industries and businesses can be considered as outperforming or underperforming a benchmark.
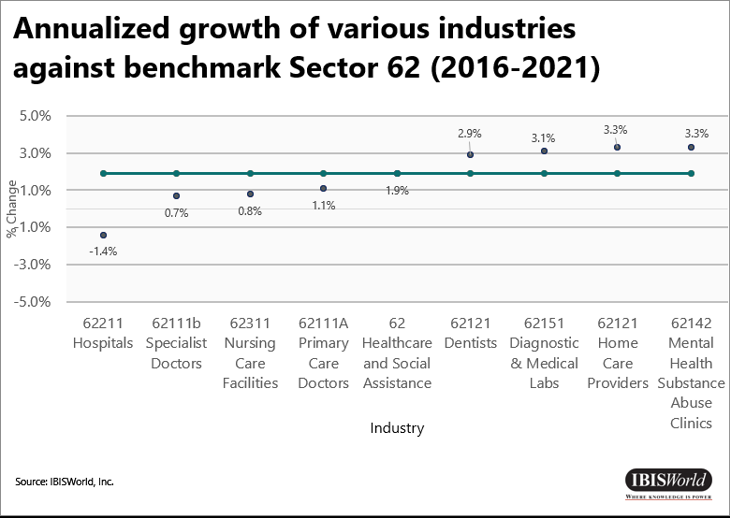
The average of a sector serves as one comparative benchmark for industries. For example, revenue for the Healthcare and Social Assistance sector is expected to increase at an annualized rate of 1.9% over the five years to 2021 (latest data available). Revenue for the Psychologists, Social Workers and Marriage Counselors industry is expected to grow at an annualized rate of 5.8% during the same period.
Comparatively, the Psychologists, Social Workers and Marriage Counselors industry is outperforming the overall healthcare sector, or in other words, the benchmark.
Within the Psychologists, Social Workers and Marriage Counselors industry, the company IBH Integrated Behavioral Health Inc. (IBH) can be compared with industry averages.
IBISWorld’s Procurement IQ platform offers financial data on private industry operators with a low to high range and confidence indicator for analysis.
IBISWorld estimates a low (1.1 times) to high (1.3 times) range for IBH’s quick ratio. Compared to the 1.7 times benchmark for the Psychologists, Social Workers and Marriage Counselors industry, found in the Industry Financial Ratios section, the company poses a higher credit risk, though with a low level of certainty.
A simple binary score can collect industry or company metrics compared with benchmarks. Use a 1 to denote outperforming and 0 for underperforming for various metrics, and then compare the sum to the potential total, giving insight into overall risk.
- Variance and statistical analysis of risk
Scores and benchmarks assess risk levels through comparison. Volatility is essentially how much something changes. One measurement measures absolute volatility.
Looking at the Hospitals industry, revenue changed an average of $82.1 million per year between 2019 and 2021, or an average of 7.4% per year, indicating high volatility during the period. Both capture the volatility of revenue over a given time.
More often, standardizing this change with a benchmark, such as the mean, indicates risk. A useful metric for this is data variance.
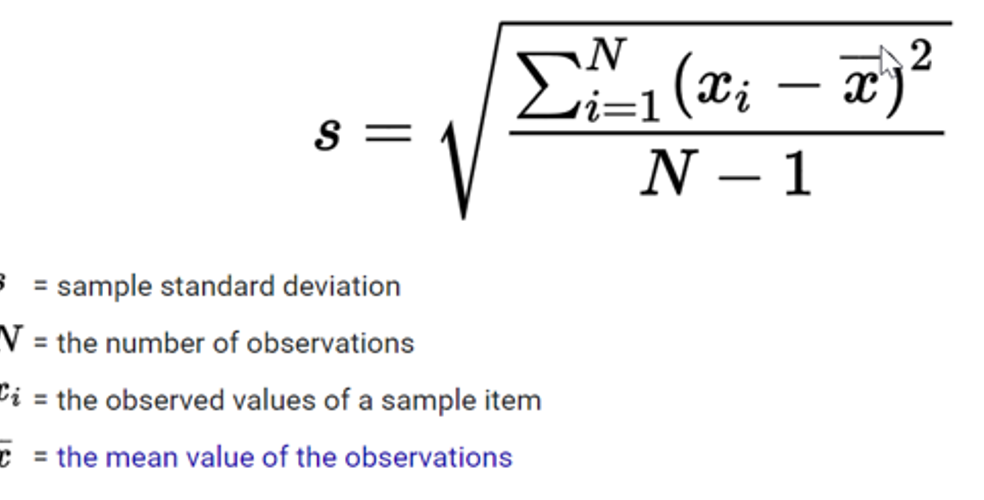
Calculating variance first requires taking the mean, or average, of a data set. Then, take each observation in the data set and subtract the mean from it to create residuals. Square each of these residuals and sum them to get the variance of the data, and assuming the data is a sample, divide by the number of observations minus one.
To get the all-important standard deviation, or average distance from the mean, take the square root of your variance.
It is important to measure by how much data tends to stray away from the average. Remember, the average value of a large data set is often thought of as the expected value.
In other words, revenue per hospital in the Hospitals industry is generally the revenue expected for a randomly analyzed hospital.
If the average is used to make predictions, but there are high levels of deviation from the average, predictions become more difficult and so risk increases.
Given a large enough data set, we may assume a normal distribution of data, indicating data frequently gathers around the average, or use a histogram to investigate the distribution.
Most often, the former is sufficient for business analysis, allowing us to make better use of data in relation to its average. These probability distributions indicate the likelihood of events occurring.
A data set with a high standard deviation indicates significant swings and changes, and so higher levels of risk. Standard deviation helps assess outliers in data.
For line graphs that chart across a period of time, using standard deviation shows high year-over-year changes in revenue, differentiating a high probability decrease or increase from a low probability, and possibly unforeseen and concerning, decrease or increase.
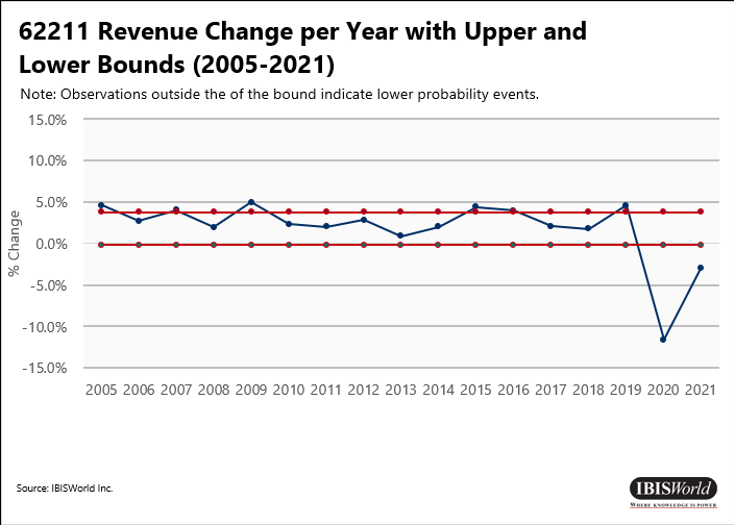
Regarding revenue for the Hospitals industry between 2005 and 2021, we first determine the average and standard deviation. By adding and subtracting one half of the standard deviation to the mean, we get our respective upper and lower bounds.
Notice most changes are within one total standard deviation, except for notable outliers including 2009, 2015 and 2020, all particularly volatile years for the industry.
Monitoring deviations from the mean also puts ratings, scores and ratios in perspective. With sufficient data over time, comparing one year’s risk rating to the average helps describe that year’s risk.
Using standard deviations, we can determine what distance from the mean might qualify as low risk, medium risk, or high risk.
The empirical rule states that, given normally distributed data, around 70.0% of data should fall within a range of mean plus one and mean minus one standard deviations. Further, 90.0% should fall within mean plus two and mean minus two standard deviations.
Theoretically, data about one standard deviation above or below the mean should not necessarily be considered high or low risk.
Validated segmenting: Early warning system and the risk matrix
Further analysis of data over time enables specific, validated segmenting of risk levels. IBISWorld provides a validated segmenting, calculated from years of data and analysis, of total risk scores and their forecast trends through its Early Warning System.
This system places an industry’s total risk score, discussed in the ratings section above, in a low-, medium- or high-risk category.
Additionally, the system determines future risk levels and the direction (increasing, decreasing, steady) of risk using forecasts. Including forecast risks to compare with the present also improves risk benefit analysis.
This helpful tool enables the construction of a risk matrix to organize information for analysis. A risk matrix categorizes current and expected risk under rows and columns.
The Early Warning System places an industry on the matrix based on the current level of risk and the direction its heading.
This enables users to easily organize a sector, group of select industries or all industries together based on a thoroughly researched, easy-to-digest measurement of risk.

Business decisions must consider the amount of risk, future risk, type of risk and the risk tolerance of the business.
By categorizing risk using the techniques discussed in this article, industries and businesses can be categorized based on different types of risk and organized in the risk matrix for comparison.
For example, risk exposure to external factors (sensitivity) versus internal risk (ratios), current performance against a benchmark versus forecast performance and other combinations form an easily digestible matrix for analysis.
With current and forecast risks in hand, the Weaknesses and Threats sections of the SWOT analysis matrix can be better understood.
Main takeaways
These risk analysis tools, like others discussed, describe and categorize levels of risk to improve the decision-making process.
They offer insight into factors underpinning risk, comparisons between different industries, and levels of certainty.
Once risk is identified and assessed, any next steps taken can be made sensibly and accurately.
Source from IBISWorld
Disclaimer: The information set forth above is provided by IBISWorld independently of Alibaba.com. Alibaba.com makes no representation and warranties as to the quality and reliability of the seller and products.