- New solar PV capacity addition in the US in 2022 was 20.2 GW DC, with an annual decline of 16%
- It was majorly due to government’s anti-circumvention tariff probe and module shipments stuck with CBP due to UFLPA
- On annual basis utility scale installations declined 31%, commercial solar dropped 6%, community solar 16%, but residential segment rose 40%
- Total installed US solar capacity is expected to grow five times, from 141 GW DC at the end of 2022 to more than 700 GW DC by 2033
- Cumulative operational solar module manufacturing capacity till 2022-end was 9 GW including 1.8 GW that came online last year
The US government’s anti-circumvention tariffs and the module detainments by the Customs and Border Protection (CBP) under the country’s Uyghur Forced Labor Prevention Act (UFLPA) led to the country installing 16% less solar PV capacity in 2022 with 20.2 GW DC coming online, but the US Solar Market Insight 2022 Year In Review expects a ‘robust return to growth’ for this market in 2023.
Utility scale installations declined 31% annually to 11.8 GW DC in 2022, including 4.3 GW DC in Q4/2022. The latter was representative of 67% sequential growth. Decline on annual basis was majorly due to supply chain challenges and trade disruptions, according to the report of the Solar Energy Industries Association (SEIA) and Wood Mackenzie.
Nevertheless, over 4.5 GW DC capacity was contracted during Q4 to take overall utility project pipeline to 90.3 GW DC, a 12% annual growth. There is still some short-term uncertainty especially with regards to tier 2 module suppliers as according to the report, CBP is reviewing smaller orders and smaller manufacturers, whereas tier I companies are confident of getting their module shipments released in H1/2023.
For utility scale, analysts forecast 139 GW DC to be added between 2023 and 2027, and 429 GW DC over the next decade under the base case.
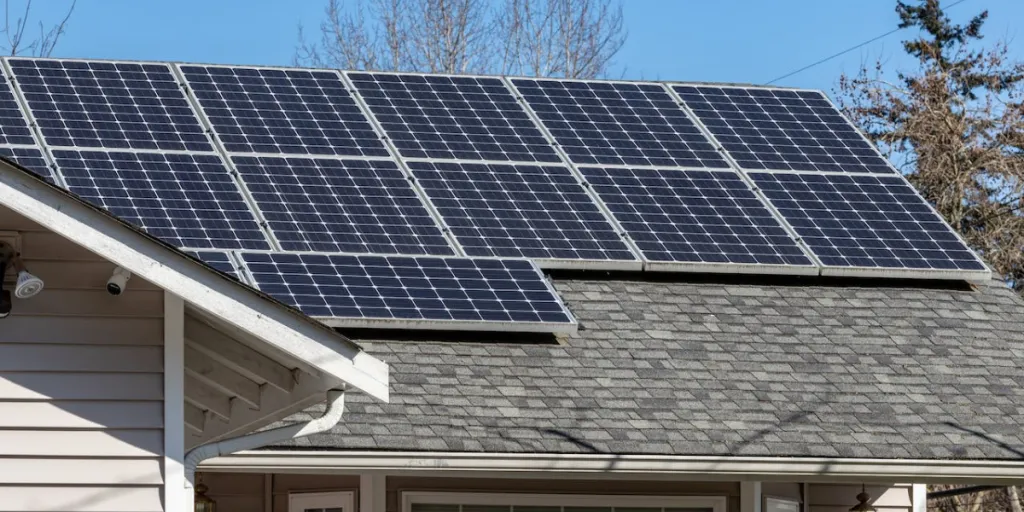
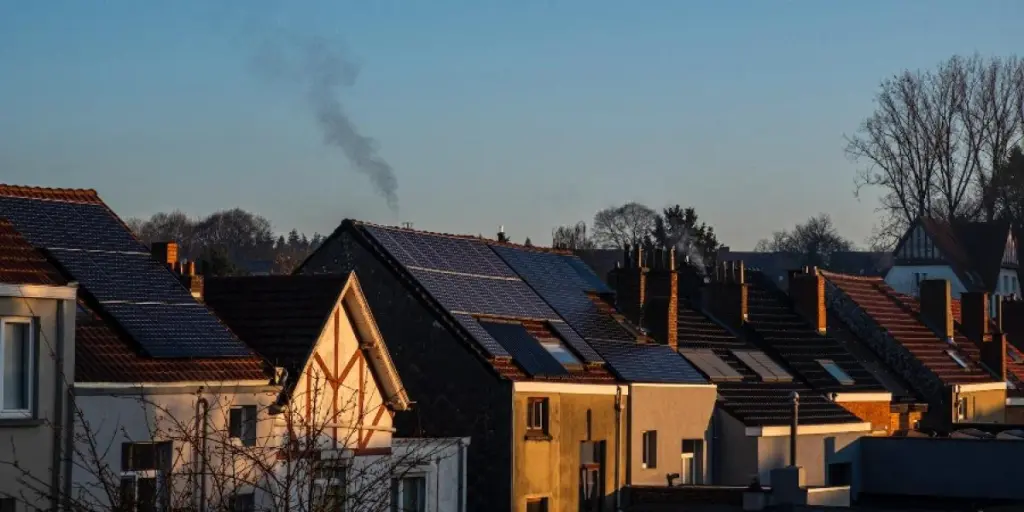
Residential solar PV segment registered a strong YoY growth of 40% last year to report 5.9 GW DC additions with close to 700,000 systems installed, including 1.68 GW in Q4. In 2023, the report writers predict 7% annual growth for this segment with strong demand from California, before NEM 3.0 that significantly reduce net metering compensation for new customers comes into effect on April 14, 2023.
Commercial solar, comprising projects distributed across commercial, industrial, agricultural, school, government or non-profits, declined 6% YoY to 1.4 GW DC in 2022, including 354 MW DC in Q4, again due to supply chain constraints. Installations are however likely to increase by 19% YoY in 2023 as delayed projects come online and the rush before NEM 3.0 comes online.
With the addition of 284 MW DC in Q4, community solar PV installations in 2022 were a total of 1.01 GW DC having come down 16% YoY. By 2027, the report writers expect the market to grow by an average of 11% between 2023 and 2027.
By 2027, 33% of new residential solar capacity and 20% of new commercial and community solar capacity will be paired with storage.
Principal Analyst at Wood Mackenzie and Lead Author of the report, Michelle Davis said, “While 2022 was a tough year for the solar industry, we do expect some of the supply chain issues to ease, propelling 2023 growth to 41%.”
The total installed US solar fleet is expected to grow five times larger than it is today, from 141 GW DC at the end of 2022 to more than 700 GW DC by 2033.
Forecast till 2027 is offered by the analysts under bull case and bear case to factor in any impacts related to supply chain dynamics, tax credit qualification, labor availability, and retail rate price trends. Under bull case scenario, the analysts expect 10% more capacity through 2027, whereas in the bear case similar amount of downside is foreseen with 11% less.
“Put another way, depending on what assumptions become reality, there is roughly 20 GW DC of upside or downside risk for the US solar industry over the next five years,” reads the report.
While impact of the Inflation Reduction Act (IRA) is set to contribute to these forecasts for various segments, it may also take the country’s total solar manufacturing capacity to 25 GW by the end of 2023 if all announcements come true. In 2022, more than 1.8 GW new module manufacturing capacity came online taking the cumulative to 9 GW, as per the analysts.
Complete report can be purchased from Wood Mackenzie’s website.
Source from Taiyang News
The information set forth above is provided by Taiyang News independently of Alibaba.com. Alibaba.com makes no representation and warranties as to the quality and reliability of the seller and products.