
There’s this fallacy among many content marketers and SEOs.
It goes like this:
Data is one of the best ways to create kick-ass content and build links. But my business/client doesn’t have any interesting data to share.
So, we’re screwed.
Today, I’m going to dispel that thinking once and for all by showing you, not only specific examples of how we’ve used publicly available data to score some major wins, but also where you can find data, and how you can use it.
Sure, new, original data and research can make for fantastic content.
But that doesn’t mean you’re screwed without it. It just means you need to get creative–to think outside the box.
And there is a ton of data out there, just waiting to be used. There’s literally an entire podcast now dedicated to people sharing facts and data – most of it old (or even ancient) news.
The point is, people love data.
And they really love if it’s presented to them in new and interesting ways.
Let’s look at some examples of how it’s being done.
Public Data In Practice
Back when I was first learning about much of the behind-the-scenes work that goes into building links, I was looking for something – anything – to score a win.
Our team hatched a plan that seems almost silly in retrospect, but at the time it made total sense. I was working for a startup that helped match students with colleges. So, we decided that we would create an infographic that showed where the U.S. senators had gone to college.
We did some quick research and found that we could find each state’s senators and the college they attended right on Wikipedia.
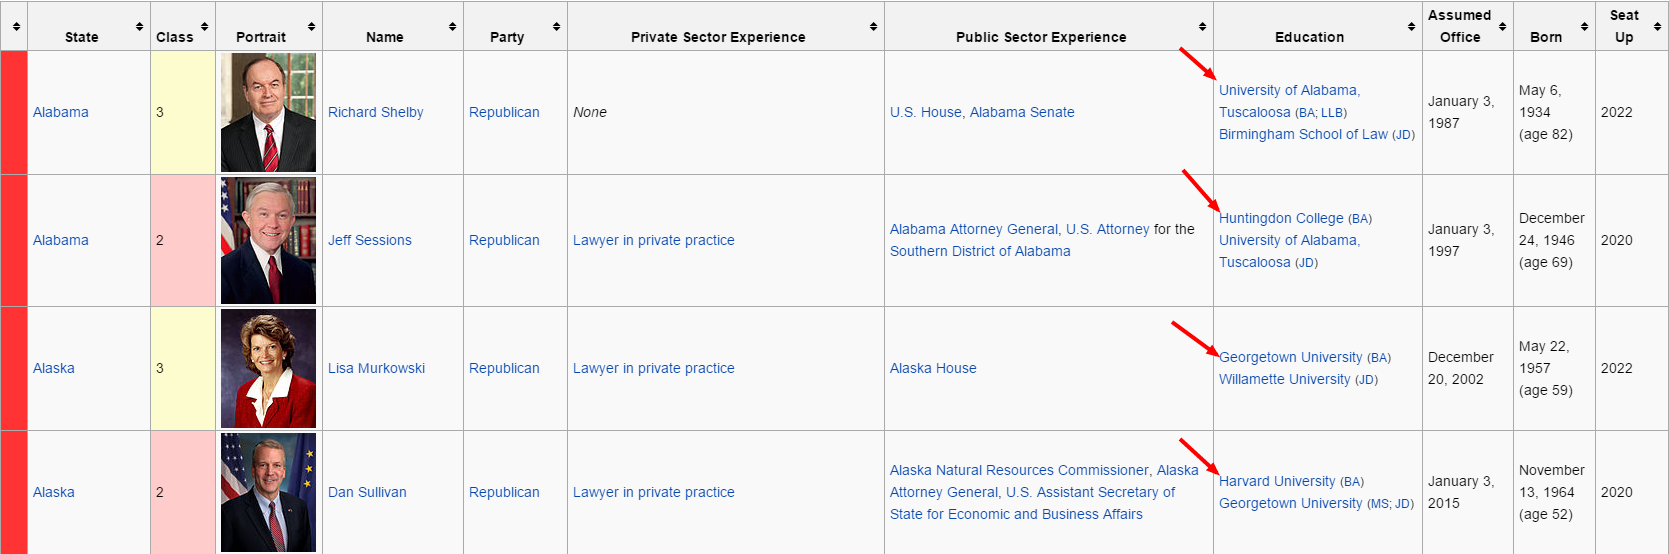
Our team went to work, grabbing the data, fact checking it, and putting it into a spreadsheet.
This was not new information. It couldn’t possible be valuable. Right?
We forged ahead anyway. With the data in hand, we created an infographic, including a map, that showed the college logo of each of the senators from each state.

When we finished the infographic, I went through an outreach process, targeting journalists who had written about politics and the congress in the past. I focused on people who had written “fun” topics (rather than straight news).
I clicked send and thought that was the end of it. It was a nice try.
But, it would never work. Right?
Well… it worked!
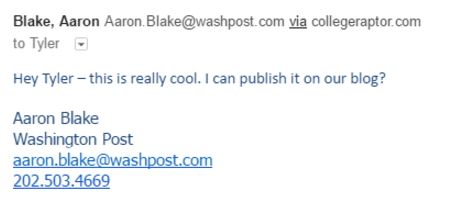
First, it was featured on the Washington Post.
But it didn’t stop there. About a dozen other sites – most of them national or regional media – picked up the graphic and it spread far and wide.
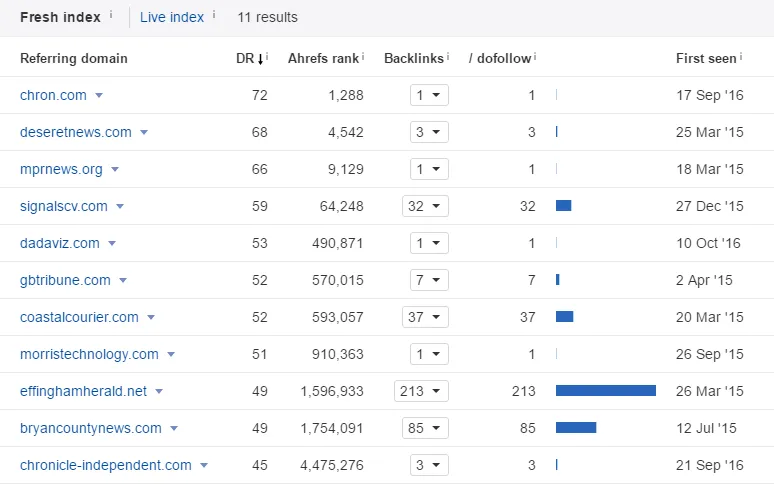
Admittedly, this was a small win in the grand scheme of things. But at the time, it felt like I had just conquered the world. We had taken data from freaking Wikipedia and turned it into some big-time backlinks.
I was obsessed.
I started scouring places to find interesting data that I could use to create more kick-ass content. I looked at other sites for their most popular data-driven content, trying to reverse engineer how the data had been compiled.
Over the last few years, I’ve found time and time again that public data can be compiled and used to create kick-ass content that actually has legs.
Not long ago, I came across this infographic from Decluttr:

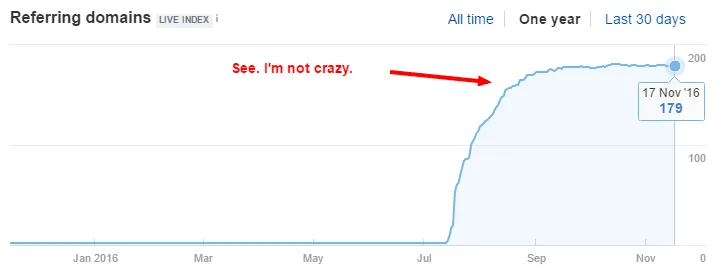
I found it because it was popping up all over my newsfeed and on Twitter. It seemed like everywhere I turned, this map was popping up.
And I wasn’t going crazy.
It had been picked up by a couple of hundred outlets:
So, I investigated further.
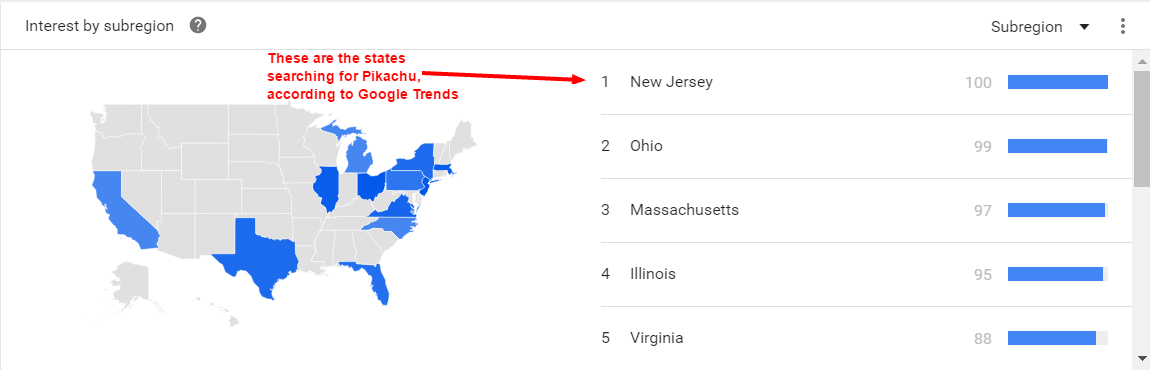
Turns out, this data came straight out of Google Trends.
Their team pulled data on search queries for things like “Where to find Pikachu” and mapped the queries by state, giving them a breakdown of the most-sought-after Pokemon in each state. (This was at the height of the Pokemon Go craze.)
This wasn’t just a one-off hit. Public data was a real asset–and people were cashing in.
Column Five even borrowed data compiled by Forbes on the most-valuable sports franchises to make it into a cool data visualization.
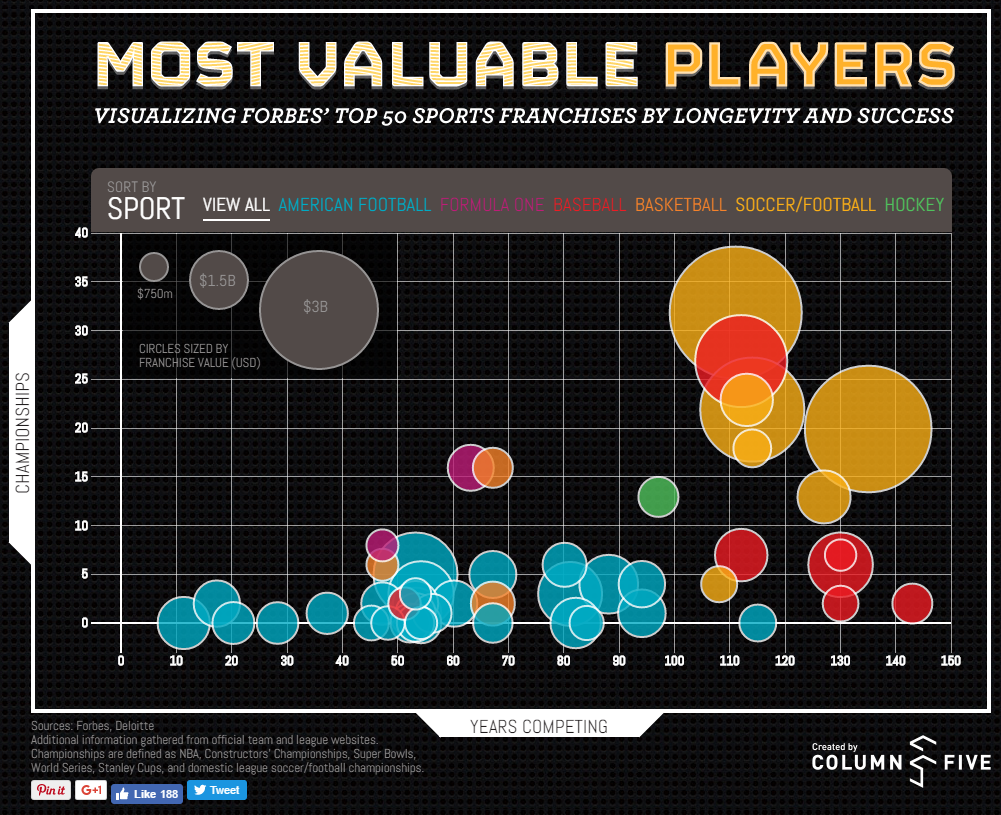
They landed placements from some huge sites like DeadSpin and USA Today. And all they did was take data that was already out there and turn it into a cool, visual asset.
This kind of data is literally one of the pillars of the Internet. And most of it was out there – just waiting to be found, compiled, and made into something useful.
Where To Find Public Data
Data is literally everywhere. As humans, we create so much of it each day, that most is never even looked at or considered.
And that’s why it’s such a lucrative opportunity.
The key to using public data is simply knowing where to look.
Here are 4 sure-fire places where you can find data to use in your content:
Federal And State Databases
You know all of those tax dollars you pay? Well some of that money goes to funding research and compiling data. And that data is then published for free, most of it online.
So, for example, if you thought it would be interesting to do an infographic on how much of your tax dollars go into funding research that ends up on the internet, you could dig into the mountain of data on the Congressional Budget Office’s website.
But that’s just the tip of the iceberg.
Data.gov indexes pretty much every public data set available. And there are nearly 200,000 data sets out there – just waiting to be used.
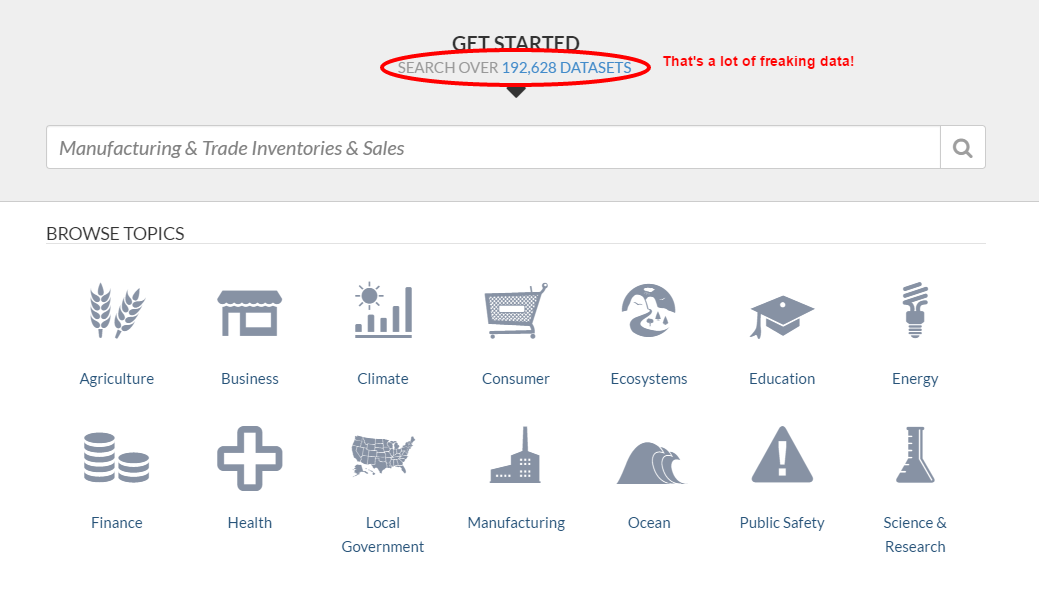
They even categorize it by sector and give you a handy search function. (Holy crap, that’s a lot of data for the taking!)
Academic And Scientific Studies
Beyond the facts and figures that are put out by the government, there are scientists and researchers all over the world publishing new data every day.
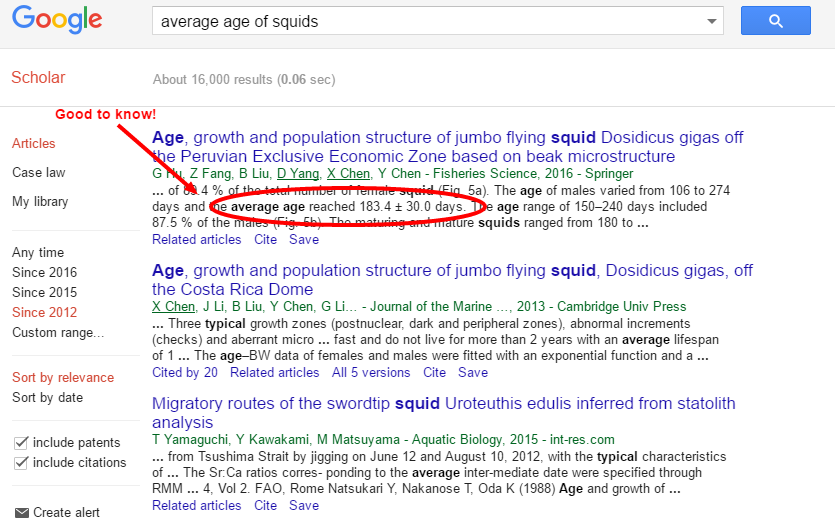
Some of it’s locked up behind paywalls, but Google Scholar makes it pretty easy to find data and research on just about any topic.
Want to create a super-cool infographic on the lifespan of squids? Say no more.
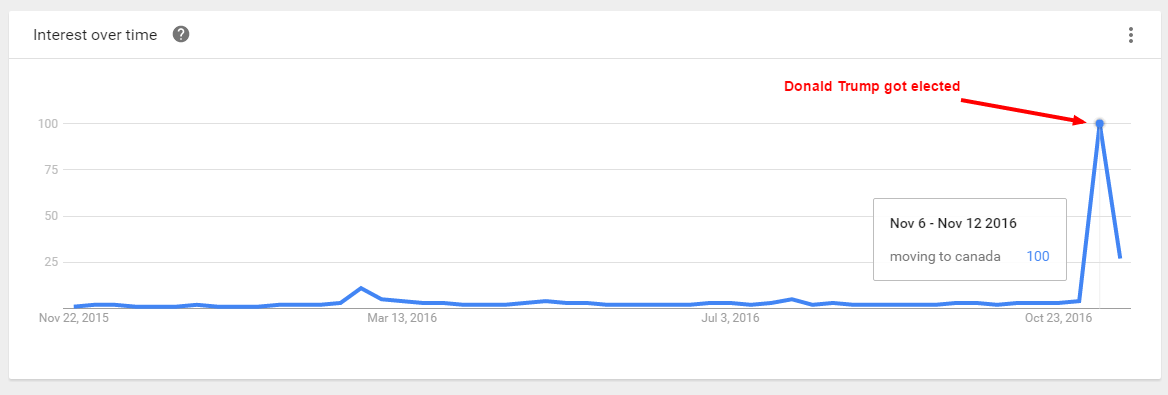
Google Trends And Search Data
We’ve seen this one used time and time again. But, Google has some really fascinating data on search behavior. You can spot trends, find differences by state or country, and do all kinds of other cool analysis.
Also, don’t forget about doing some manual data collection with the auto-complete functionality. That’s another media favorite!
Facebook Page And Advertising Data
An often-overlooked source of public data is Facebook.
They don’t make it super easy to find, but if you’ve ever used the advertising platform, you know that you can use their targeting features and see – in real time – the size of your target audience.
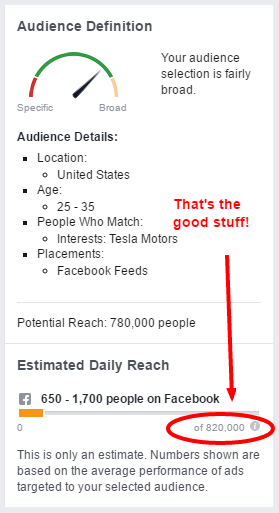
This means that you can use this data to compile charts, graphs, or maps of people’s preferences and demographics.
SIDENOTE.
Just take your time and get to know the tool and how it calculates your audience size. And, of course, provide plenty of disclaimer that the data is based only on Facebook users and not ultra-precise.
How To Use Public Data Sets
Let’s assume that you’ve done your homework, found some nice, juicy data.
Now, what?
This is the fun part. Seriously. The sky’s the limit.
Data is so valuable because there are nearly infinite ways to use it to create new and interesting content.
Here are a few ideas:
1. Create Graphs, Charts, And Infographics
Time-tested, backlink-approved. A simple, interesting data viz in the right hands is one of the most effective forms of content for earning links.
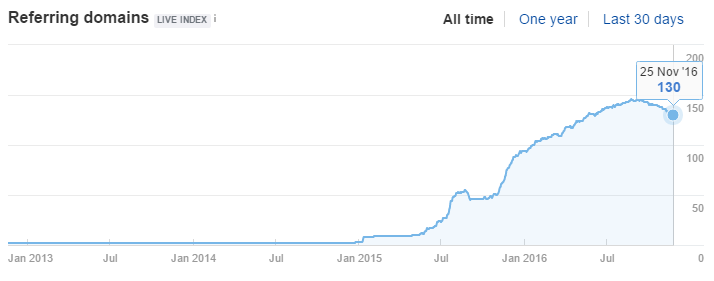
DataCamp.com put together a pretty cool – albeit rather basic – infographic comparing R and Python. The data they have is all sourced from other studies and websites.

But, guess what? They’ve still earned linked from nearly 150 domains. Not bad.
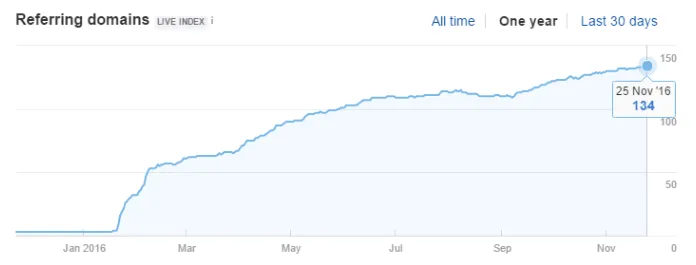
Referring domains from Ahrefs Site Explorer > Overview
2. Make Maps By State, Country, Or Region
If the data you find has a dimension of location, then it’s game on. Maps are super popular and the media goes gangbusters for a nice, color-coded breakdown of how the world is either super different or incredibly similar.
Sites like Estately have made this a common practice–and to great success.
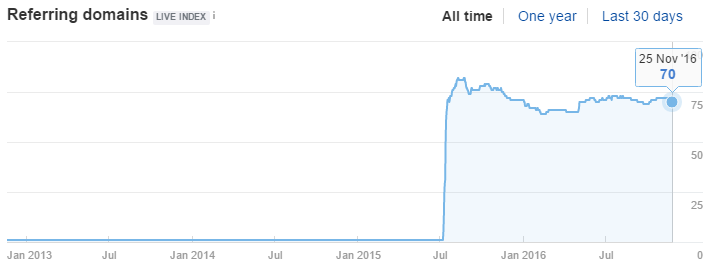
Their map of “The Most ‘American’ States” compiled a bunch of public data to create a state-by-state breakdown of patriotism.
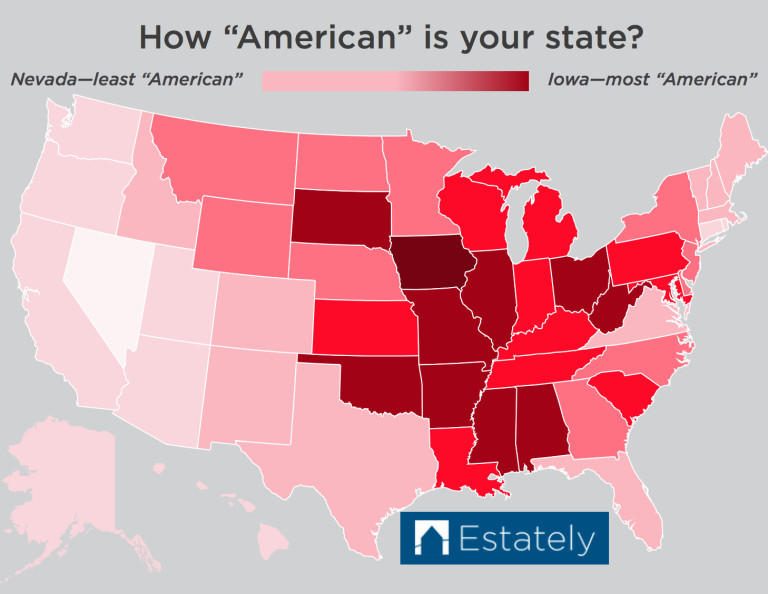
And, they scored some major wins with 70 referring domains right out of the gate.
SIDENOTE.
We call these ‘infomaps’ and they are crushing it right now for link building. See our visual link building post for more.
3. Rankings And Ratings
The basis for any kind of legitimate rating or ranking is a data-driven methodology. You can mix up some public data – like reviews or objective quality scores – to create a ranking that passes muster.
GetApp.com ranks the best CRMs each quarter, and their methodology is fully spelled out. Most of it comes from compiling public data like customer review scores and integration counts.
But they’ve become a go-to authority because their rankings use a data-driven, objective approach to quantifying quality.
4. Remix Or Layer Data In Interesting Ways
Sometimes, a single data set is just not fun enough.
Try combining data from various sources (where it makes sense, statistically speaking) and create a layered data set. Many of these examples have made use of it – and you can see it everywhere when you start to look.
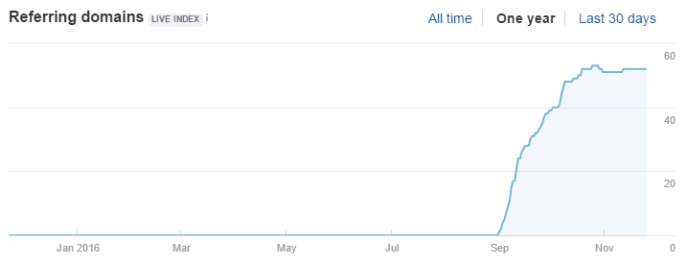
Take, for example, this huge analysis of the best cities for music fans by ValuePenguin.
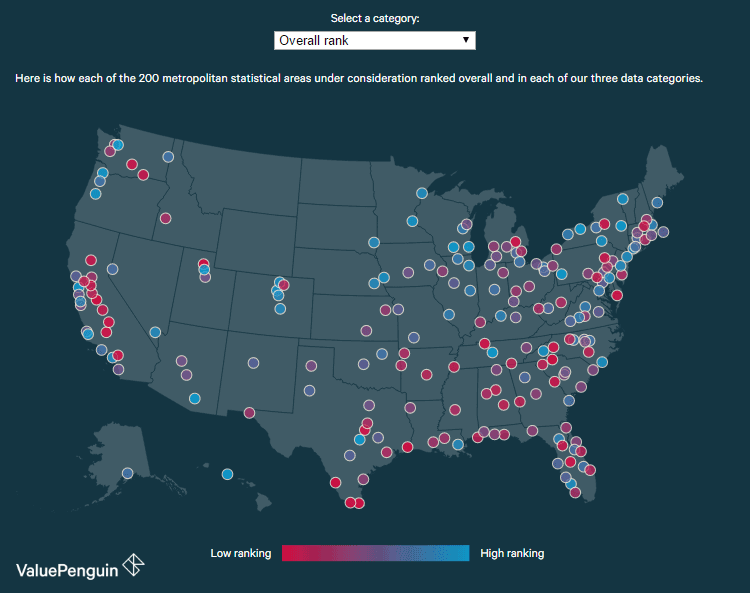
They spell out all of the data points that they used – and none of them are unique or proprietary! But they layered the data from multiple sources in a new and interesting way.
And they’ve been handsomely rewarded – over 50 referring domains in the past two months.
Now It’s Your Turn
What cool things can you create with the public data that’s all around us?
If you ever run out of free, public data, then we’ll be in trouble. But, until then – nerd out!
Source from Ahrefs
Disclaimer: The information set forth above is provided by Ahrefs independently of Alibaba.com. Alibaba.com makes no representation and warranties as to the quality and reliability of the seller and products.