
Businesses need regular product line assessments in order to know which products bring in the most sales, which generate losses, and which parts of their business require improvements.
A proper product assessment can help the average business to optimize their strategy and boost profits. And that’s exactly where the Boston Consulting Group (BCG) growth-share matrix comes in. No doubt, other tools and practices are available, but the BCG matrix offers a simple and straightforward approach which is ideal for identifying and then leveraging the strong points of a business.
So keep reading to find out more about how the BCG growth-share matrix can be used to boost your business’s strategy today.
Table of Contents
What is a growth share matrix?
How to create a BCG matrix
A case study of BCG matrix
Does the BCG matrix have limitations?
Final thoughts
What is a growth share matrix?

The BCG matrix, also known as the growth-share matrix, is a planning model that assesses all products in a business’ inventory and categorizes them based on their market share and growth.
The Boston Consulting Group was the creator of the BCG model, and it has been a golden standard for over 50 years. The BCG matrix provides a framework for businesses to evaluate products to determine which may need more investment, and which may not.
Also, the framework helps brands discover which existing products they can improve or even which products they can introduce to capitalize on the market share.
With the BCG matrix, brands can create long-term strategic plans and identify new opportunities for market growth. Also, business owners can easily control their present and future investments with this planning framework.
What are the four categories of the growth share matrix?
The Boston Consulting Group believe that brands can divide their business units into four categories. These categories form the structure of the growth-share matrix. They include cash cows, stars, dogs, and question marks.
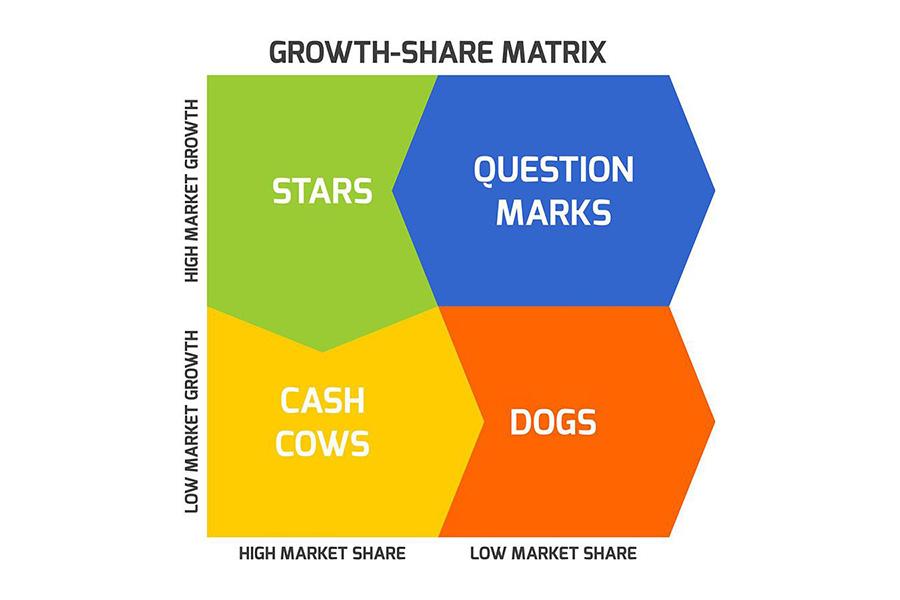
Cash cows
Cash cows are units with high market share and low growth potential. In other words, products that belong in the cash cow quadrants generate significant return on investment (ROI), but they belong to a market with zero or low potential for growth.
The main advantage of this business unit is that businesses will always get more than they invest. Cash cows can generate enough money to cover corporate debts, capitalize on question marks, account for a brand’s administrative costs, pay shareholder dividends, and fund development and research.
It’s recommended that businesses leverage cash cows to gain more profit and maintain productivity. A good example is the Coca-cola beverage, sold in over 200 countries globally.
Stars
Stars have the highest market share and growth potential of any business unit. This business unit also generates a lot of money but consumes an equally large amount because of its rapid growth rate.
For this reason, stars may generate the same amount of cash that companies invest. Moreover, stars can develop into cash cows if they don’t die out before the market growth rate reduces.
Brands should consider investing in the star business units to grow their business. Kinley, a product of the Coca-cola company, is a perfect example of a “star.” The product is in a growing industry: bottled water. So, it requires significant investment to keep growing.
Question marks
Question marks are the business units with potential. They have high growth rates and low market shares. Brands with practical strategies and investments can turn questions marks into cash cows or stars.
But since they have a low market share, question marks could become dogs and might not improve no matter how much businesses invest. However, such situations will only happen if brands use the wrong strategies and investments. A great example of a question mark in the Coca-cola company is “Fanta.” It hasn’t been able to experience global growth like Coca-cola, but it has the potential—if the company uses the right strategies to grow it.
Dogs
Dogs have the lowest market share and growth potential of all four categories. As a result, these business units don’t need huge investments and won’t generate any profits either.
Products under the dog quadrant are cash traps because they can keep most businesses stagnant. Hence, brands should avoid investing in these business units because they have very low ROI and often cause divestiture. For example, diet coke is one of the dogs in the Coca-cola company that doesn’t require much investment and won’t make much profit either.
How to create a BCG matrix
Here’s how brands can classify products into the four categories of the BCG matrix.
Step one: Select the product

First, brands need to select the product they want to classify. This step is crucial as it’s a driving point for the analysis. The first step isn’t limited to products only. Brands can also classify an individual brand or a firm into categories.
Step two: Define the company’s target market

Businesses need to be careful when defining a product market. If brands don’t specify the market correctly, it will lead to wrong classifications.
For instance, classifying Coca-cola’s carbonated drink in the smoothies market will place it in the dog quadrant, which would be the wrong move. However, it should be a cash cow in the soda market. Thus, brands must define markets properly to understand the product’s market position.
Step three: Measure the market share

A company’s market share is the section of the total market the company holds. Brands can measure their market share in terms of revenue of unit volume.
The BCG matrix uses relative market share to compare product sales with the leading rivals. However, the product under comparison must be the same as the rival.
Here’s what the formula looks like:
Relative Market Share = Product’s annual sales/top rival’s yearly sales
For instance, if a brand’s market share for cosmetics was 10% in 2020 and the leading rival’s market share was 25%, the brand’s relative market share would be a mere 0.4.
Note: Brands can get the relative market share on the x-axis of the BCG matrix.
Step 4: Identify the market growth rate

There are two ways brands can determine the market’s growth rate. They can find it through online sources or calculate it. Brands can calculate the market growth rate by noting the average revenue growth of firms leading the market (use percentage terms to measure market growth).
Brands can identify market growth rate with the following formula:
(Product sales this year – Product sales last year)/Product sales last year
If a market has high growth, it means the total market share has the potential to expand, giving all businesses in that market a chance to make profits.
Step 5: Plot the circles on the matrix
The last step is plotting the final values on the BCG matrix. The matrix’s x-axis represents the relative market share, while the y-axis represents the market growth rate.
Brands can draw circles to represent each unit. Also, the circle’s size should match the revenue the unit generates. In other words, small circles for small revenues and big circles for significant revenues.
A case study of BCG matrix

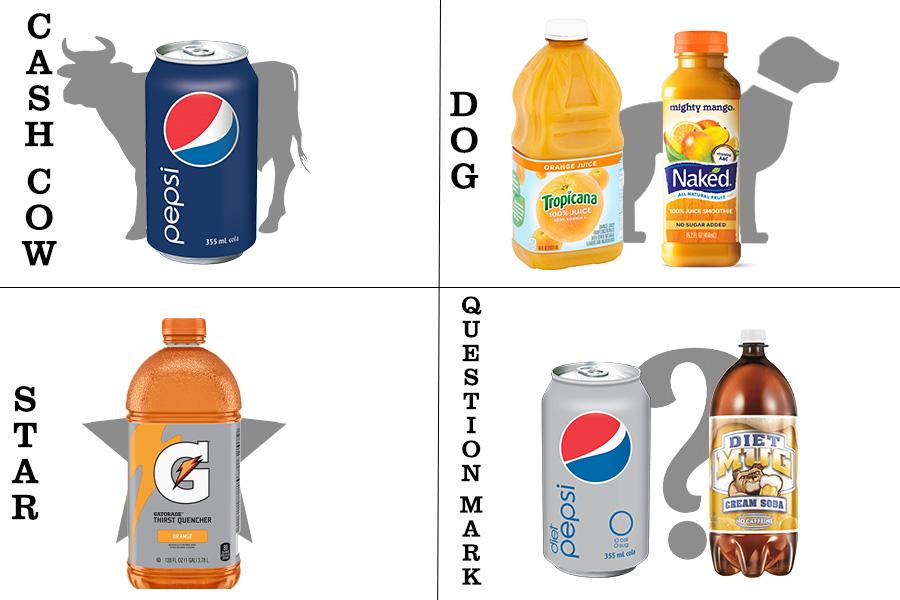
Real-life examples can help brands better understand how to use the BCG matrix. A good example is PepsiCo, which produces other beverages besides its famous soda.
In the BCG matrix example for PepsiCo, diet Pepsi and Mug diet cream soda are question marks because they have a moderate amount of consumers and still have growth potential.
PepsiCo’s sports drink, Gatorade, is a star since it dominates the sports drink market and accounts for 70% of sales in that market—-without any signs of slowing down.
PepsiCo’s titular drink is a cash cow because it has a high market share (rivaled by Coca-Cola) but experiences low growth rates.
PepsiCo’s Tropicana and Naked once starred in the fruit drink market. But with PepsiCo revealing the brands’ falling sales and a willingness to sell them off, it’s right to say both Tropicana and Naked are in PepsiCo’s dog category.
Does the growth share matrix have limitations?
Although the BCG matrix has some great qualities, it also has its limitations. These limitations include:
- The BCG matrix is limited to two dimensions: market growth rate and market share. It’s a significant limitation because these are not the only dimensions indicating attractiveness, success, or profitability of a product.
- The matrix doesn’t account for the synergies that can occur between brands.
- A low market share doesn’t mean a business won’t be profitable.
- Also, high market shares won’t always generate high profits. Brands would need increased investment to have a chance at getting a high market share.
- Dogs are not always bad. Sometimes, they can help brands gain a competitive market advantage.
- BCG doesn’t account for small competitors with fast-growing market shares.
Final thoughts
The BCG matrix is an effective tool that helps brands control their current, and map their future investments. Its four quadrants help businesses decide which units should be prioritized, improved, or eliminated.
Although BCG is mainly for businesses with large portfolios, it can also be used to generate strategies that shoot newcomer brands to the top of the market. And with this in mind, this article has outlined five simple steps businesses can follow to conduct a BCG matrix analysis.